In the realm of vision models, the primary mode of representation is using pixels to rasterize the visual world. Yet this is not always the best or unique way to represent visual content, especially for designers and artists who depict the world using geometry primitives such as polygons. Vector graphics (VG), on the other hand, offer a textual representation of visual content, which can be more concise and powerful for content like cartoons, sketches and scientific figures. Recent studies have shown promising results on processing vector graphics with capable Large Language Models (LLMs). However, such works focus solely on qualitative results, understanding, or a specific type of vector graphics. We propose VGBench, a comprehensive benchmark for LLMs on handling vector graphics through diverse aspects, including (a) both visual understanding and generation, (b) evaluation of various vector graphics formats, (c) diverse question types, (d) wide range of prompting techniques, (e) under multiple LLMs and (f) comparison with VLMs on rasterized representations. Evaluating on our collected 4279 understanding and 5845 generation samples, we find that LLMs show strong capability on both aspects while exhibiting less desirable performance on low-level formats (SVG). Both data and evaluation pipeline will be open-sourced.
Vector graphics are an alternative way to depict the visual world, widely used in content like cartoons, sketches and scientific figures.
In our benchmark, we divide our tasks into two categories: understanding and generation.
For understanding, we designed three different question types for each of the vector graphics based on their individual strength.
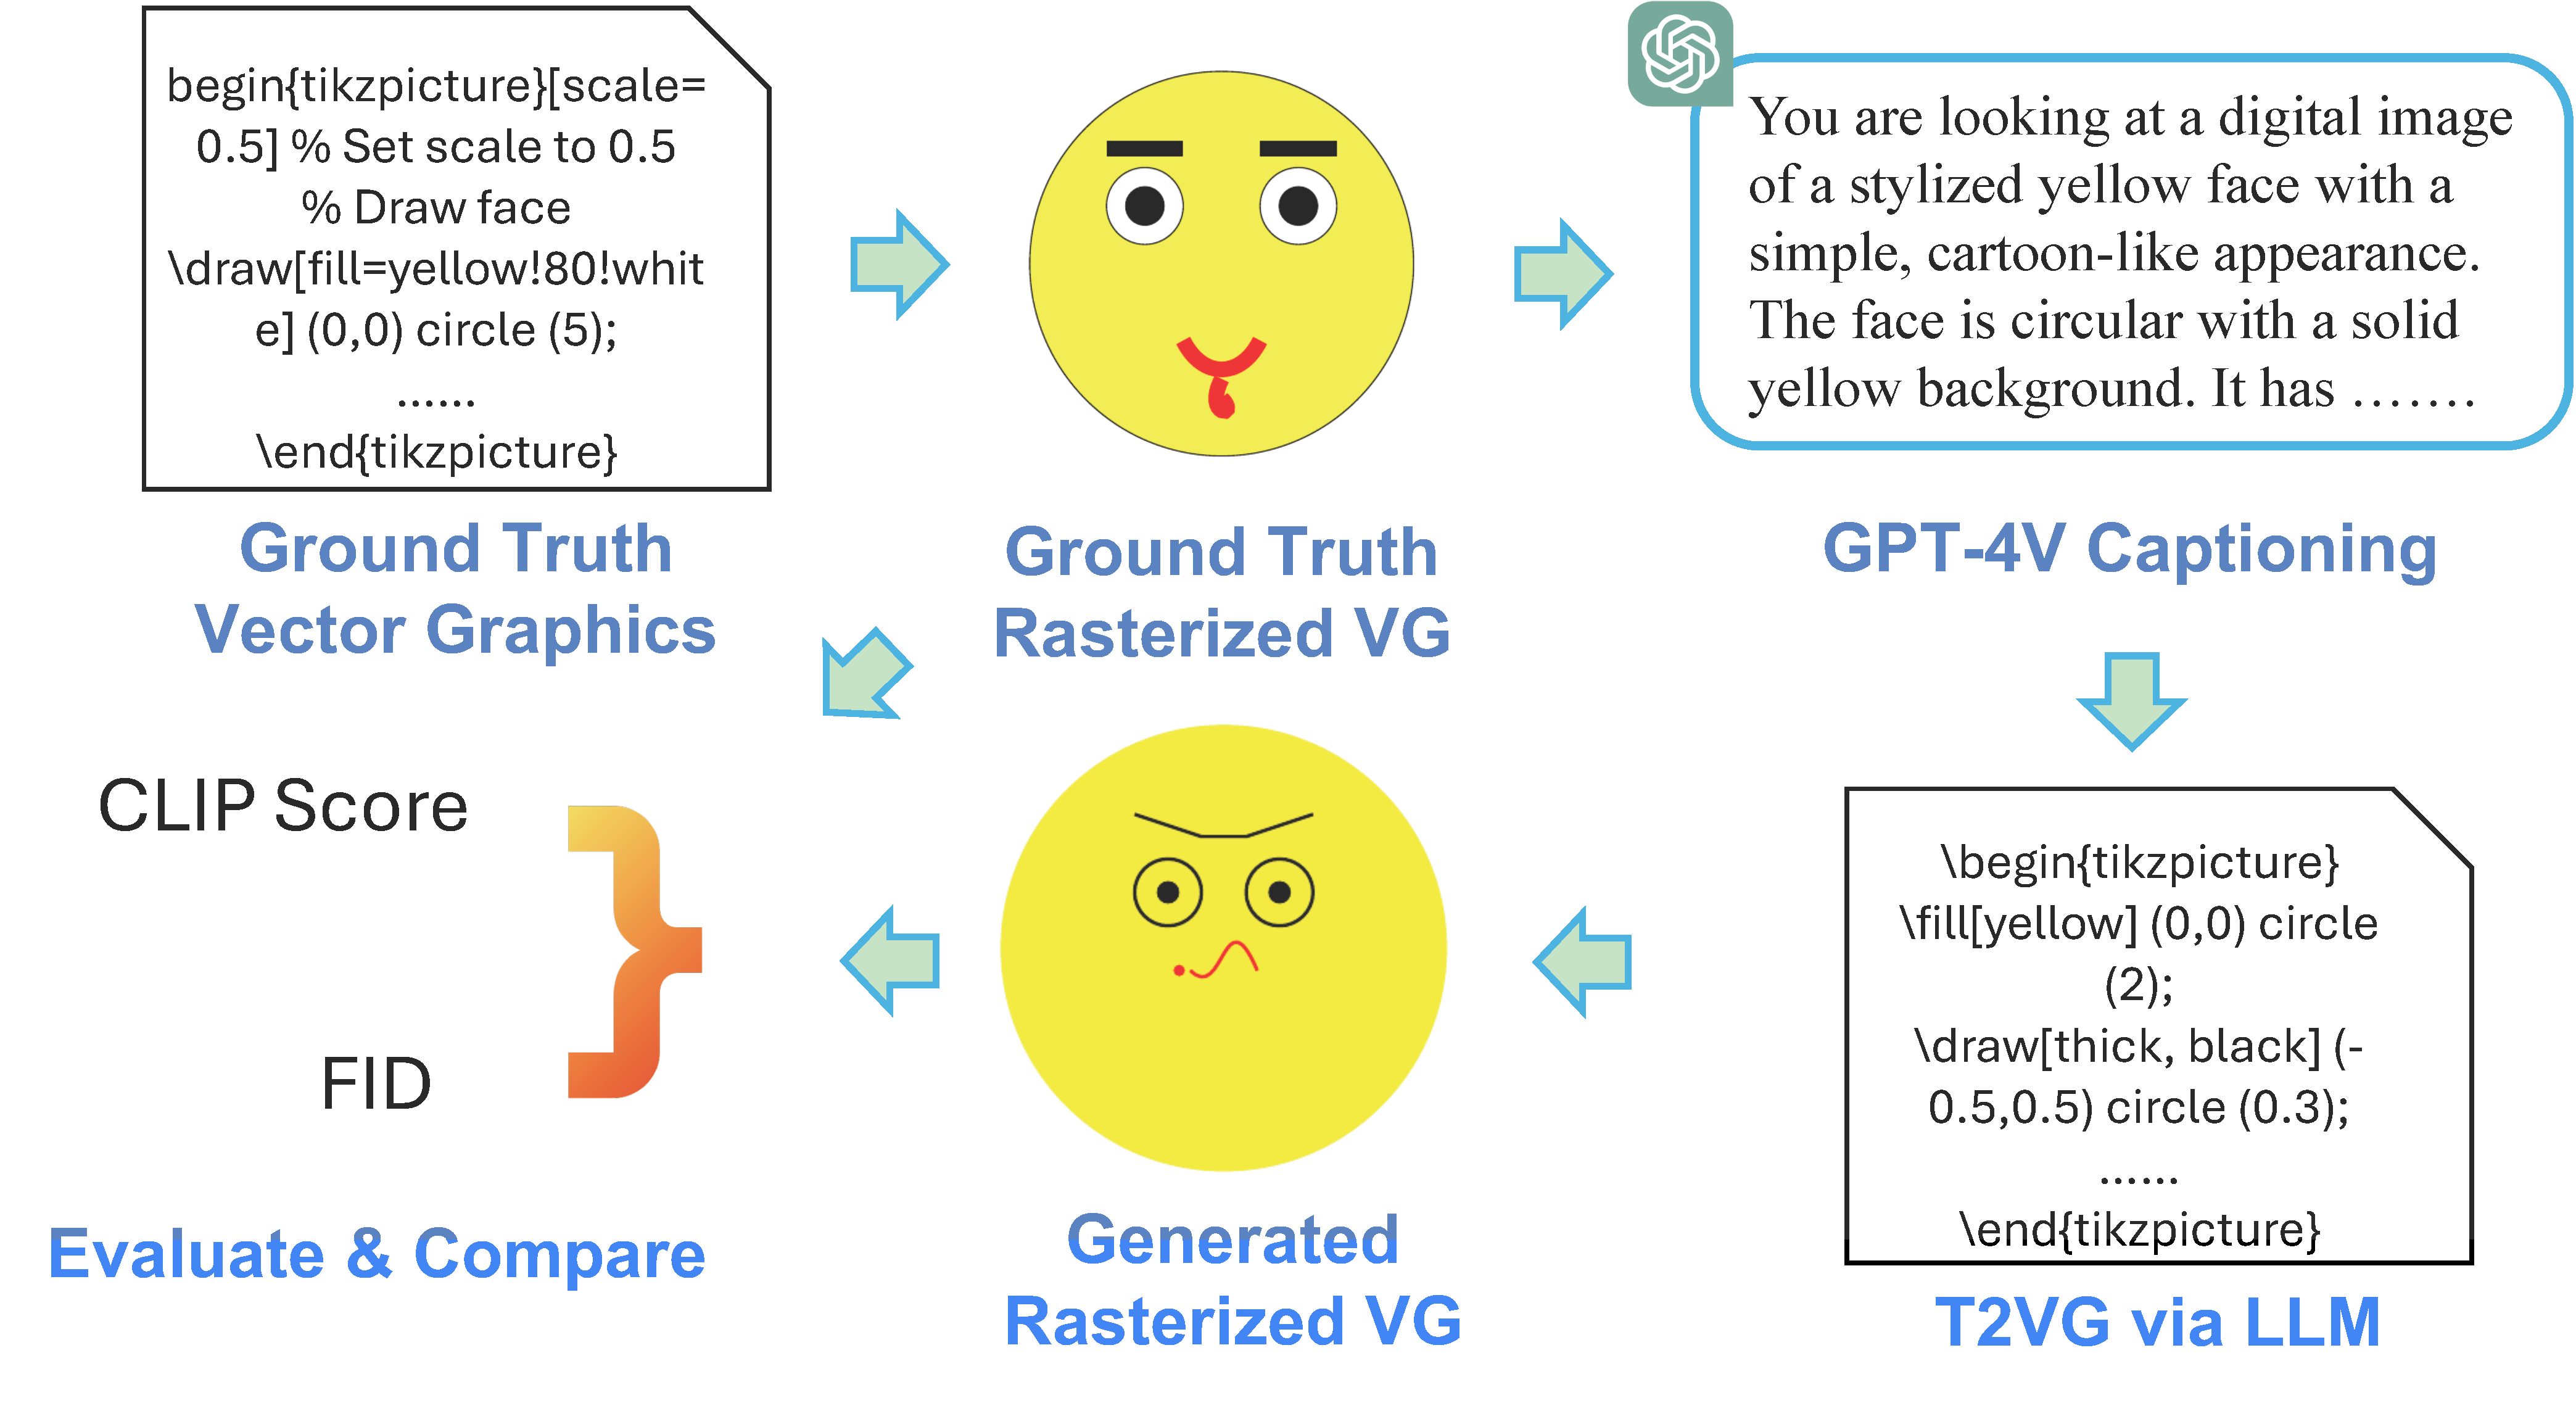
First, we obtain captions for each vector graphics image by leveraging GPT-4V over its rasterized image. Then we prompt the LLM to generate the vector graphics code corresponding to the caption. Finally, we map the generated vector graphics into rasterzied images, then use CLIP Score and Fréchet Inception Distance (FID) Score to evaluate the quality of the generated vector graphics. The scores of the ground truth image is used as the upper bound to objectively evaluate the quality of the generated images.

Vector graphics are converted into PNG format, then GPT-4V is utilized to generate the questions and answers (QA) candidates. Finally, human annotators filter the QA pairs to obtain the high-quality QA dataset.

GPT-4 shows stronger performance in high-level vector graphics language (e.g., TikZ, Graphviz) compared to low-level vector graphics language SVG.
Different vector-graphic formats show diverse behaviors upon question types, where the results demonstrates that GPT-4 shows inferior performance in low-level vector graphics tasks, especially on tasks related to reasoning.
It can also be seen in our ablation study that GPT-4's performance varies significantly along each vector graphics code range.
| SVG | TikZ | Graphviz | ||||||||||
|---|---|---|---|---|---|---|---|---|---|---|---|---|
| Model | Category | Color | Usage | Avg | Concept | Counting | Relation | Avg | Domain | Layout | Relation | Avg |
| GPT-4o | 52.5 | 80.4 | 60.3 | 64.4 | 87.0 | 75.0 | 77.3 | 79.8 | 83.6 | 75.0 | 83.7 | 80.8 |
| GPT-4 | 41.2 | 72.8 | 50.6 | 54.9 | 89.4 | 77.5 | 76.0 | 81.0 | 84.6 | 82.3 | 86.6 | 84.5 |
| GPT-3.5-Turbo | 33.4 | 50.5 | 47.1 | 43.7 | 76.7 | 56.8 | 54.4 | 62.6 | 83.6 | 62.5 | 63.5 | 69.9 |
| Gemini-1.5-Pro | 39.2 | 73.2 | 47.9 | 53.4 | 86.7 | 74.9 | 71.8 | 77.8 | 79.5 | 66.8 | 86.0 | 77.4 |
| Llama-3-8B | 32.3 | 39.8 | 48.0 | 40.0 | 64.6 | 53.0 | 45.9 | 54.5 | 68.0 | 52.5 | 55.8 | 58.8 |
| Llama-3-70B | 46.3 | 58.7 | 55.3 | 53.4 | 78.5 | 68.2 | 66.7 | 71.1 | 72.8 | 61.4 | 74.4 | 69.5 |
| Qwen2-7B | 33.3 | 48.7 | 46.3 | 42.8 | 79.4 | 64.7 | 58.3 | 67.5 | 81.8 | 57.3 | 68.6 | 69.2 |
| Qwen2-72B | 43.4 | 62.4 | 55.9 | 53.9 | 88.6 | 74.6 | 72.5 | 78.6 | 86.5 | 71.5 | 80.8 | 79.6 |
| Phi-3-Mini-128K | 34.1 | 29.8 | 49.7 | 37.9 | 70.6 | 52.5 | 50.7 | 57.9 | 74.7 | 58.9 | 68.6 | 67.4 |
| Phi-3-Medium-128k | 43.6 | 44.7 | 60.6 | 49.6 | 80.4 | 59.7 | 62.8 | 67.6 | 81.4 | 66.5 | 72.7 | 73.5 |
| LLaVA-1.5-13b | 83.0 | 85.2 | 84.0 | 84.1 | 64.3 | 34.3 | 44.8 | 47.8 | 46.7 | 53.9 | 49.7 | 50.1 |
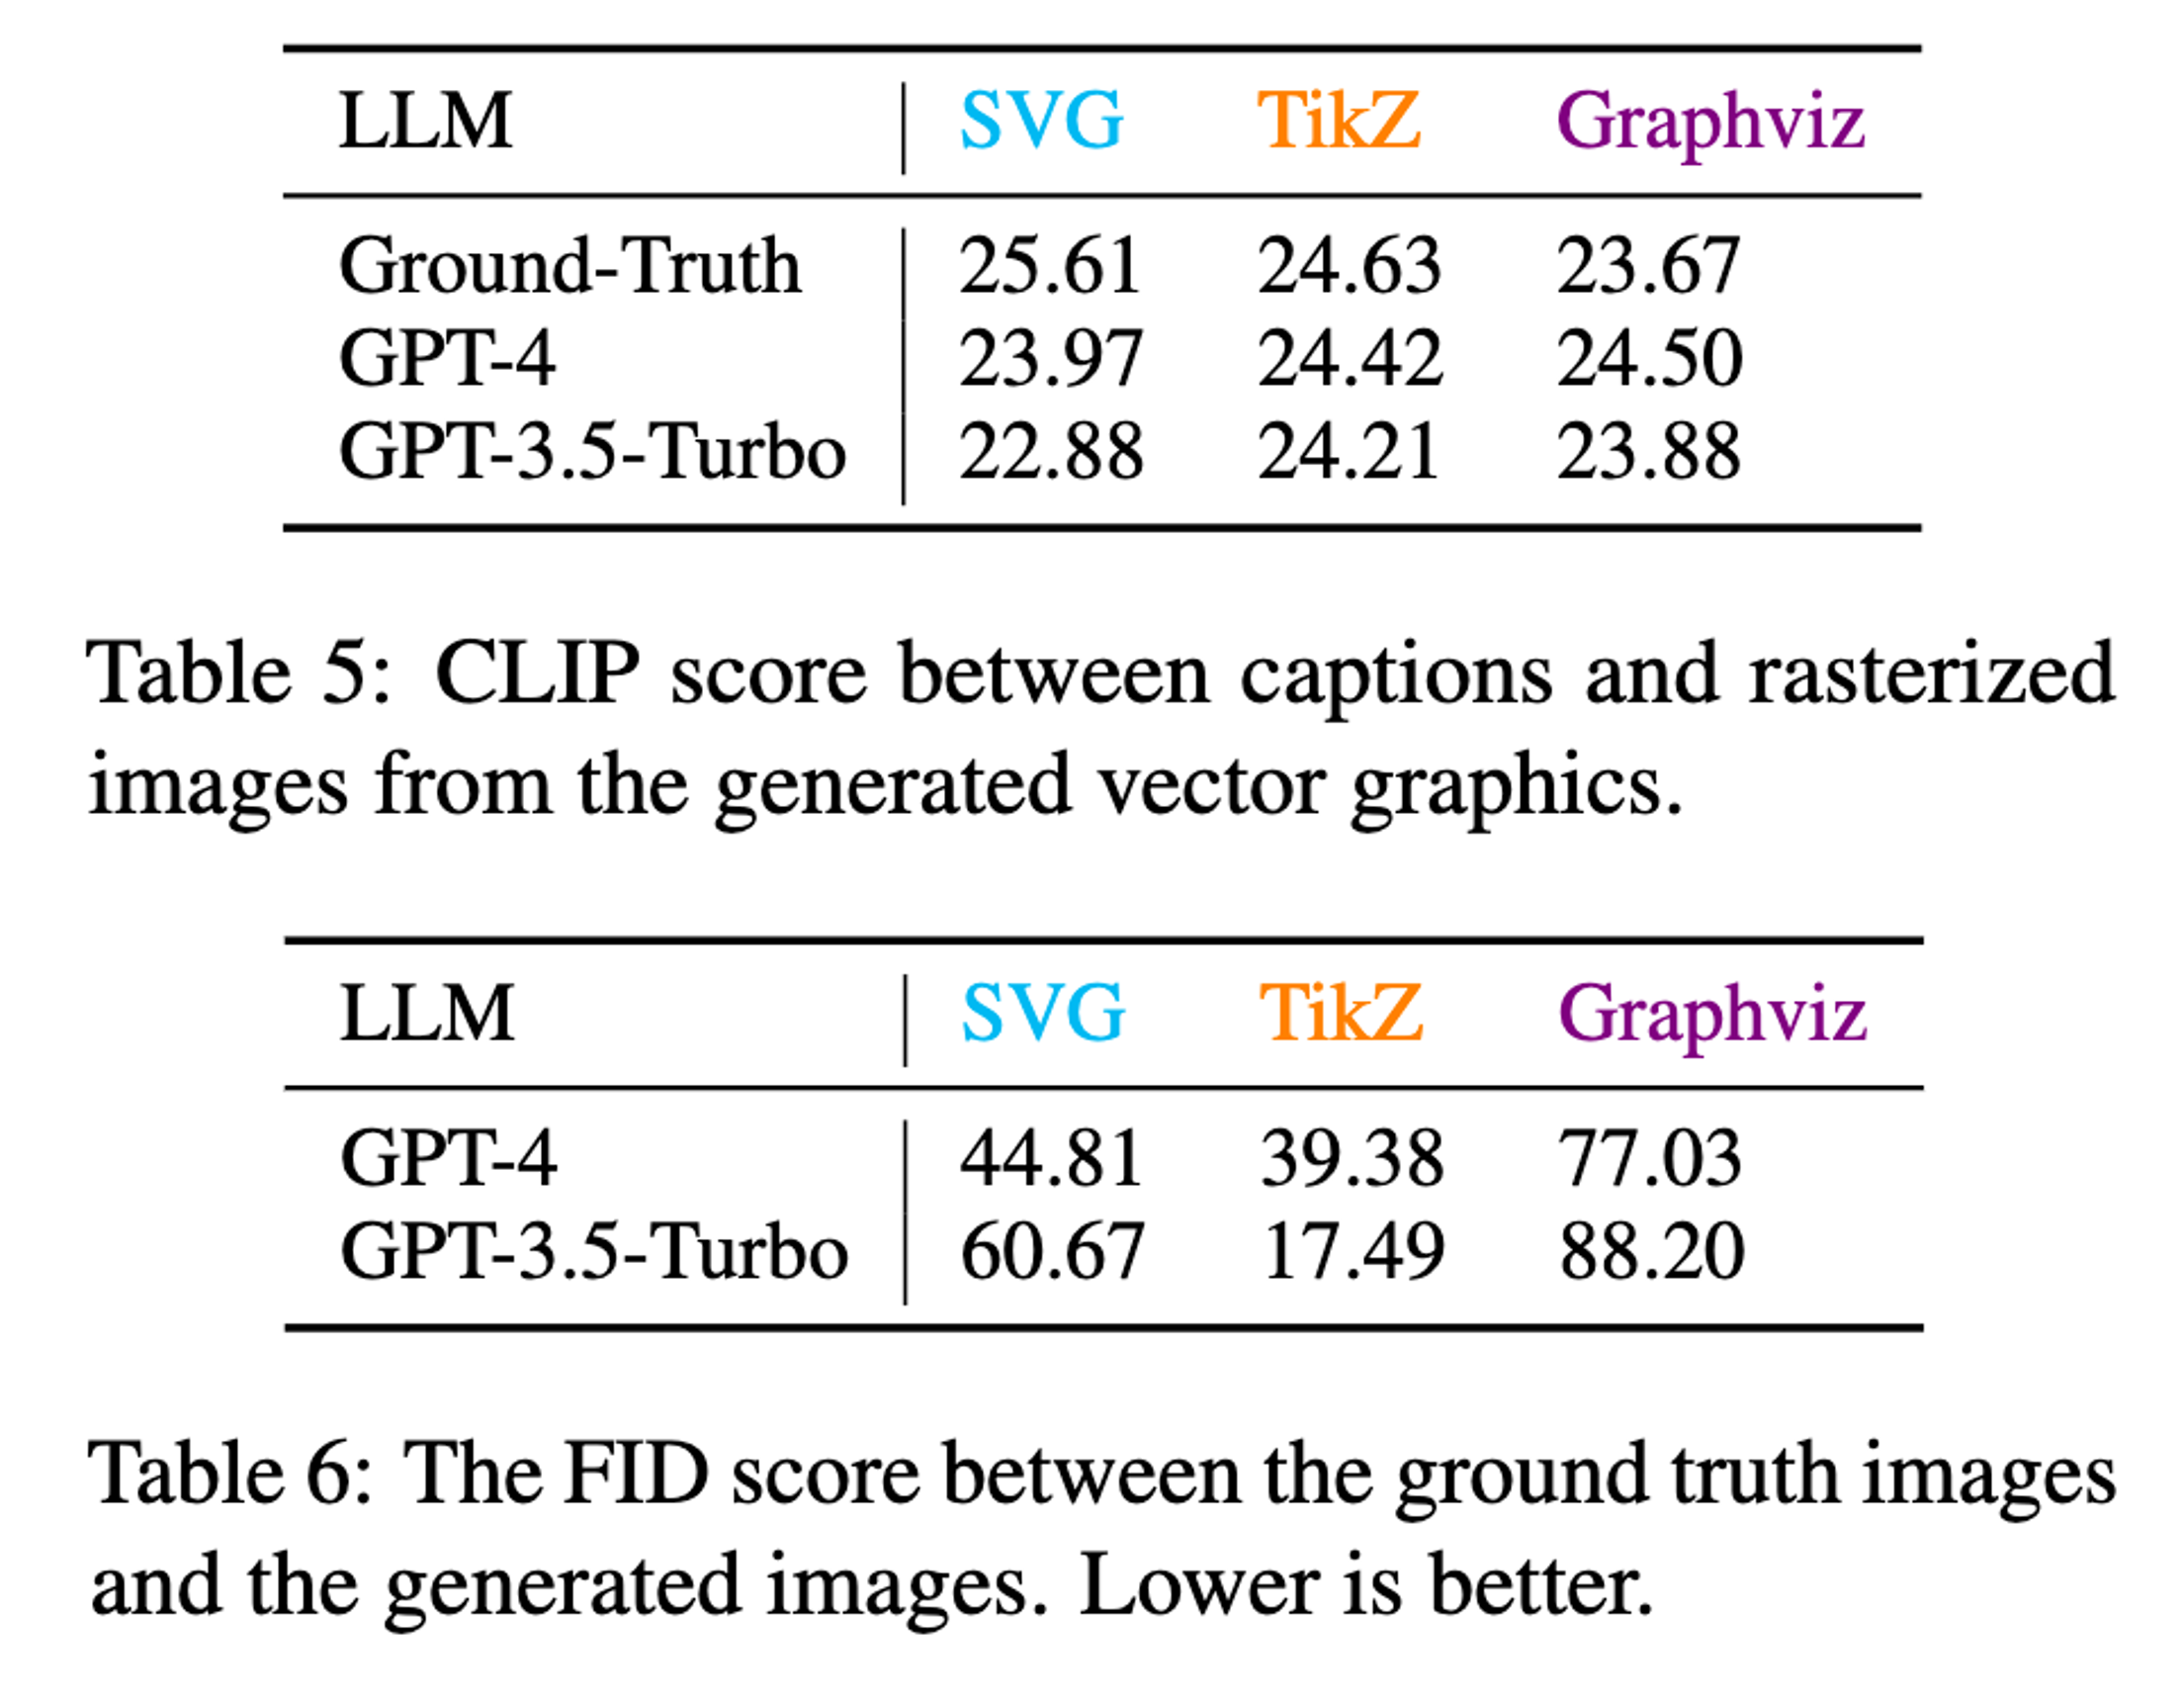
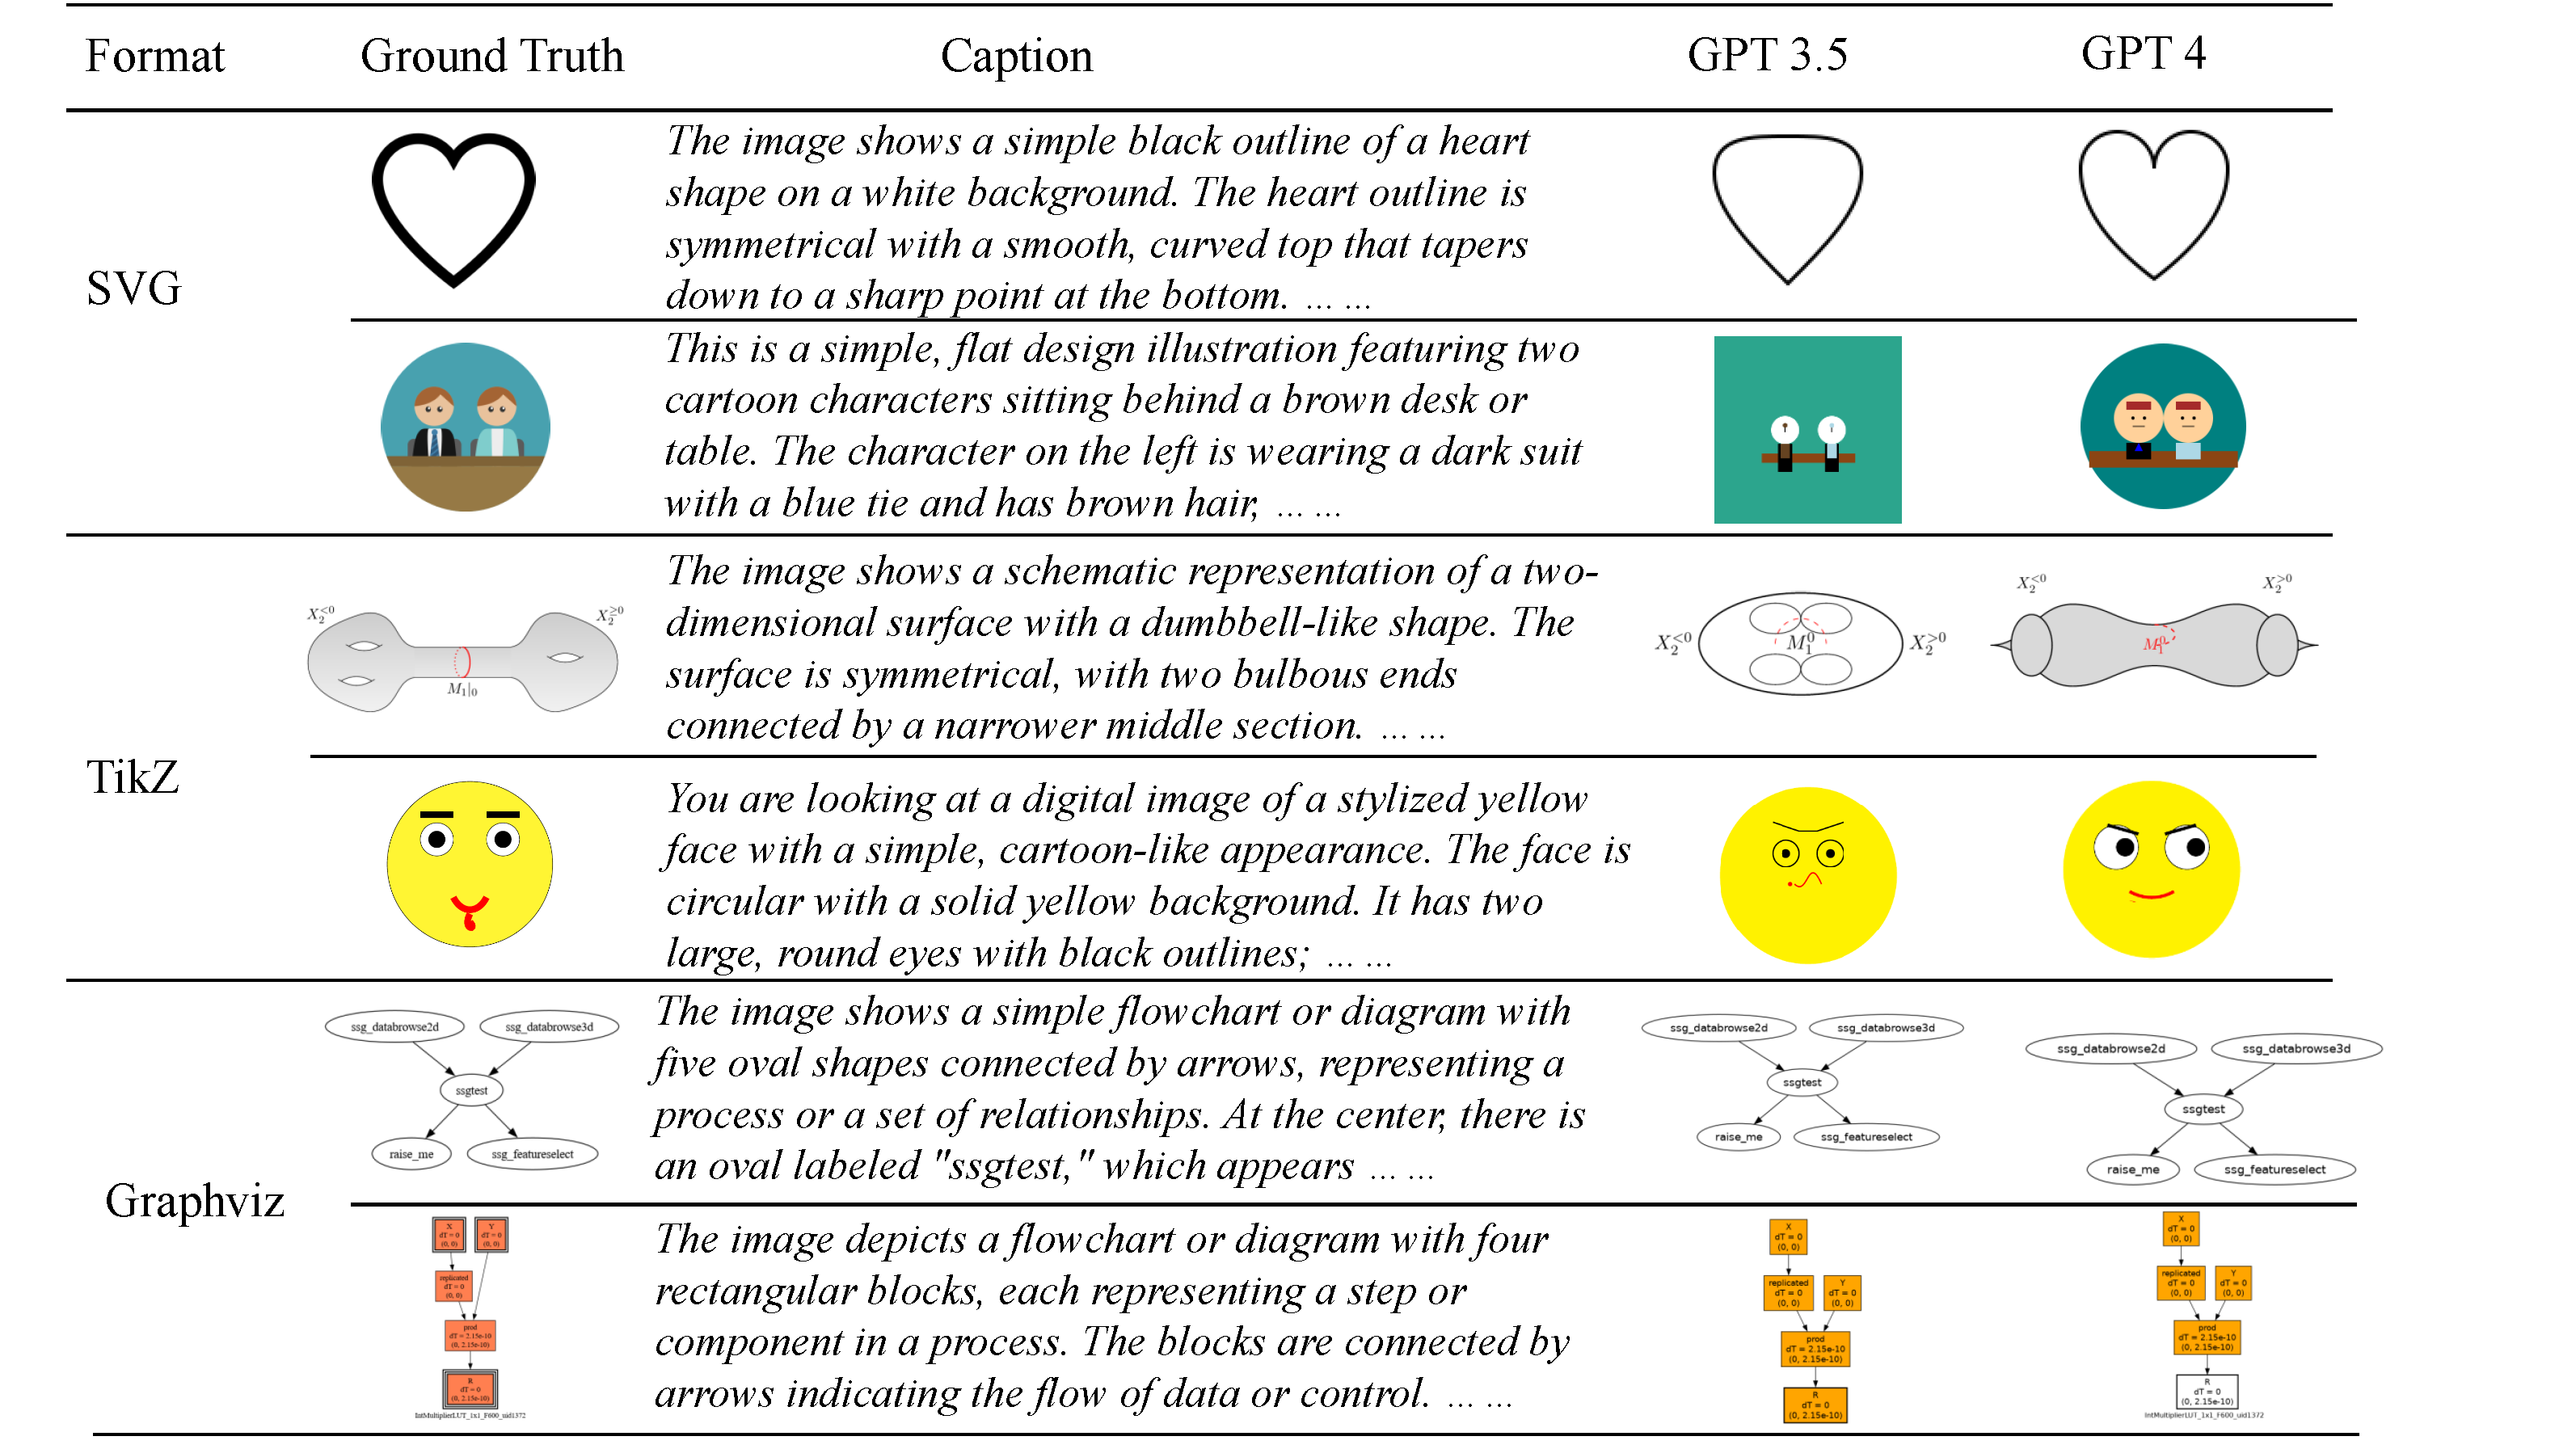
Both GPT-3.5 and GPT-4 show strong vector graphics generation capability. GPT-4 shows better performance than GPT-3.5 on CLIP score. Qualitative examples including the heart shape and flowchart generation also demonstrate the promising capability of VG generation using LLMs.


@inproceedings{zou-etal-2024-vgbench,
  title = "{VGB}ench: Evaluating Large Language Models on Vector Graphics Understanding and Generation",
  author = "Zou, Bocheng  and
    Cai, Mu  and
    Zhang, Jianrui  and
    Lee, Yong Jae",
  editor = "Al-Onaizan, Yaser  and
    Bansal, Mohit  and
    Chen, Yun-Nung",
  booktitle = "Proceedings of the 2024 Conference on Empirical Methods in Natural Language Processing",
  month = nov,
  year = "2024",
  address = "Miami, Florida, USA",
  publisher = "Association for Computational Linguistics",
  url = "https://aclanthology.org/2024.emnlp-main.213",
  pages = "3647--3659",
  abstract = "In the realm of vision models, the primary mode of representation is using pixels to rasterize the visual world. Yet this is not always the best or unique way to represent visual content, especially for designers and artists who depict the world using geometry primitives such as polygons. Vector graphics (VG), on the other hand, offer a textual representation of visual content, which can be more concise and powerful for content like cartoons, sketches and scientific figures. Recent studies have shown promising results on processing vector graphics with capable Large Language Models (LLMs). However, such works focus solely on qualitative results, understanding, or a specific type of vector graphics. We propose VGBench, a comprehensive benchmark for LLMs on handling vector graphics through diverse aspects, including (a) both visual understanding and generation, (b) evaluation of various vector graphics formats, (c) diverse question types, (d) wide range of prompting techniques, (e) under multiple LLMs and (f) comparison with VLMs on rasterized representations. Evaluating on our collected 4279 understanding and 5845 generation samples, we find that LLMs show strong capability on both aspects while exhibiting less desirable performance on low-level formats (SVG). Both data and evaluation pipeline will be open-sourced.",
}
This website is adapted from Nerfies, licensed under a Creative Commons Attribution-ShareAlike 4.0 International License. We thank the LLaMA team for giving us access to their models, and open-source projects, including Alpaca and Vicuna.
Usage and License Notices: The data, code and checkpoint is intended and licensed for research use only. They are also restricted to uses that follow the license agreement of CLIP, LLaMA, and GPT-4. The dataset is CC BY NC 4.0 (allowing only non-commercial use) and models trained using the dataset should not be used outside of research purposes.
Related Links: [Instruction Tuning with GPT-4]